8.1/10
(Our Score)
Product is rated as #29 in category Business Intelligence
What You Will Learn:
Tableau Interface Overview
Connect and Prepare Your Dataset
Create Data Extracts
Create Text Viz
Add Custom Shapes to Tableau
Create Combo Chart Using Icons and Bar Chart
Create Donut Chart
Create Offset Bar Chart
Create Top N Bar Chart Using Dynamic Parameters
Create Trending Chart using Dual Axis
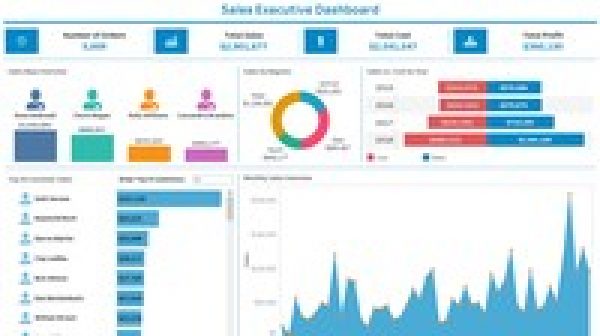
Design Sales Executive Dashboard Layouts
Develop Dashboard with Design Best Practices
Instructor Details
Votes: 0
Courses : 1
Specification: Hands-On Learning TABLEAU 2018: Sales Executive Dashboard
|
7 reviews for Hands-On Learning TABLEAU 2018: Sales Executive Dashboard
Show all
Most Helpful
Highest Rating
Lowest Rating
Add a review

| Price | $10.99 |
|---|---|
| Provider | |
| Duration | 2 hours |
| Year | 2020 |
| Level | All |
| Language | English |
| Certificate | Yes |
| Quizzes | No |

Hands-On Learning TABLEAU 2018: Sales Executive Dashboard
$10.99


Anya Tsirklin –
All of lecture 3 is blurry
Leonardo –
It was an excellent tool for my development, thank you very much Sivin.
Pavan –
The Video Quality is really Bad and got pain in my eyes after watching Video. I would say the video streaming is 480p after I clicked on 720p in settings. Recommended Video for Tableau Beginners and not for Intermediate and Advanced Users. Data set used is Sample super store. I thought the Data set is more complex. No Advanced LOD’s , calculated fields, Analsysis, complex parameters are used. Just a simple charts creation which are pushed into Dashboard. Some of the worksheets creation like Sheets like ICON Total sales, ICON Total cost, ICON order quantity and ICON Total Profits are not explained. I am already using Tableau and got very frustrated as the Videos explanations are too much dragged. NOT upto my Expectations.
Waseem –
Awesome tutorial. Got to learn most of the things with respect to Dashboards. Surely recommended.
Ajay Tawaniya –
Video looks good but video quality is not good some part it is bullring so we are not able to clear video. plz work on this and should be use more calculated fields .
Andreea Palici –
Overall, I like this course because it is hands on. Pros: very practical, advanced topics, advanced charts. Cons: difficult for a beginner, he skipped a few steps at the dashboard. I would like to get a link to download the icons used on top of the dashboard and maybe a separate lesson with the logic behind the layout, like how to wireframe a layout first and then put the sheets into the pre built layout. My dashboard doesn’t look as clean as the instructor’s.
Rama –
Clear Explanation.