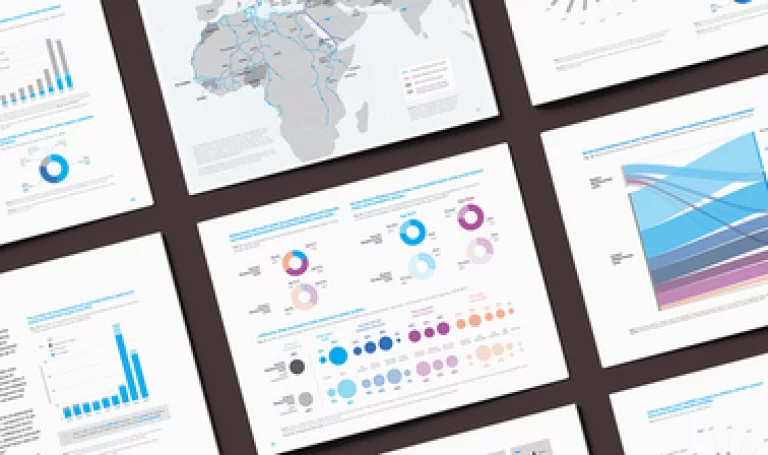
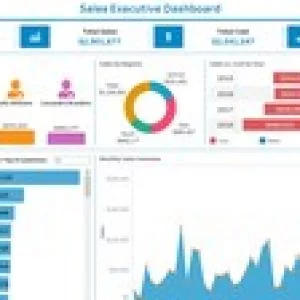
Power BI is a robust business analytics and visualization tool from Microsoft that helps data professionals bring their data to life and tell more meaningful stores. This four–week course is a beginner’s guide to working with data in Power BI and is perfect for professionals. You’ll become confident in working with data, creating data visualizations, and preparing reports and dashboards. Take this course if you are a: Beginner level data professional Student, Researcher, or Academic Marketing analyst, business and data analyst, or financial analyst Course Requirement: Windows computer. (Power BI Desktop is only available on Windows. Mac users can use powerbi.com, but this has limited capabilities and will not follow directly with the course). Course Suggestion: Work or school email account. (You cannot sign up for a powerbi.com account with a personal email address. You can complete 95% of this course without signing up for powerbi.com. However, in Week 4, an account is needed to if you want to publish a report). Image Attribution: “Data visualization & Infographic/UNICEF reports Vol. 1” by Shangning Wang, Olga Oleszczuk is licensed under CC BY–NC–ND 4.0
Instructor Details
Courses : 1
Specification: Analyzing and Visualizing Data with Power BI
|
3 reviews for Analyzing and Visualizing Data with Power BI
Add a review Cancel reply
This site uses Akismet to reduce spam. Learn how your comment data is processed.
| Price | Free |
|---|---|
| Provider | |
| Duration | 60 hours |
| Year | 2021 |
| Level | Beginner |
| Language | English |
| Certificate | Yes |
| Quizzes | No |

FREE



T.m.mohamed Usman –
This course give you an basic knowledge on Power BI software Environment by Microsoft crop. By studying this course, we can get How to analysis data especially Business data, and make eye candy as well as intelligent report out of your data. It quit worth to study this awesome software. It‘s a primarily course but covers most of the functions in Power BI, and you can earn certificate from Microsoft itself.
Raja Vel –
I took this course and it was very well formulated with good examples, quiz, lab exercises to have hands on experience…
Worth for the cost and certificate gained by end of the course if you cross 70% above on all Quiz/Labs/Surveys.
I loved taking this course and recommend folks to take too if interested..
Olia Fjodorowa –
It’s an easy course with practical exercises. if you do get stuck, the forum is very active. the video’s are short and you can bookmark the ones that you want to return to later. if you really want to, you can complete the course in 3 days too.