Make sure to check out my twitter feed for monthly promo codes and other updates (@easystats3)
Learning and applying new visual techniques can often be a daunting experience. This is especially true if you need to generate and code data visualizations yourself.
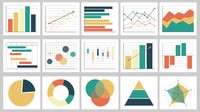
This course is designed to provide you with a compact, and easy to understand, set of videos that focus on the basic principles behind many common data visualization and how you can code them in Stata.
The course is modular; just click on the graphs that you are most interested in and learn away. You do not need to follow this course linearly.
This course will teach you many different methods to visualize data and how to generate these yourself in Stata
Visualizing and graphing data is a vital in modern data analytics. Whether you are a data scientist, student of quantitative methods or a business user, having an understanding of how to visualise data is an important aspect in getting data information across to other stakeholders. Many different ways of visualising data have been devised and some are better than other. However, each method has advantages and disadvantages and having a solid understanding of what visualization might be best suited is key to delivering a concise and sharp data message .
Specification: Data Visualization in Stata
|
User Reviews
Be the first to review “Data Visualization in Stata” Cancel reply
This site uses Akismet to reduce spam. Learn how your comment data is processed.

| Price | $14.99 |
|---|---|
| Provider | |
| Duration | 8.5 hours |
| Year | 2022 |
| Level | Beginner |
| Language | English ... |
| Certificate | Yes |
| Quizzes | No |

$24.99 $14.99


There are no reviews yet.