
This introductory course will quickly get you up to speed creating quality graphics in R using the ggplot2 package.
In this course, we’ll cover:
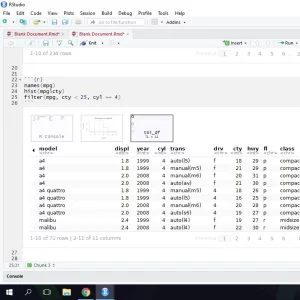
Getting started with R and R Studio
Getting started with R Markdown Documents
How to import data using:
built–in datasets
csv and text files
Excel spreadsheets
creating data on the fly
The basics of ggplot2:
scatter plots
line graphs
multiple graphs (facets)
color
Adding titles, subtitles, axis labels, and captions
Themes
What you’ll learn:
After completing this course, you’ll have the tools you need to start creating professional graphics in R using ggplot2.
You’ll apply the grammar of graphics as implemented in ggplot2 to build graphics layer–by–layer and understand how to customize your graphics using facets and color.
Are there any course requirements or prerequisites?
You will need to have R and RStudio Desktop installed on your computer (Mac or PC) as well as an internet connection to download and install packages within RStudio Desktop. An overview of installing R and RStudio is part of the course.
Who is this course for?
If you currently create multiple data visualizations in spreadsheets, you’ve probably wondered how you could improve your work or how you could more efficiently work with large datasets. Or, if you have to recreate graphics repeatedly, you might be looking for a tool to make your work more reproducible.
Specification: Introduction to Data Visualization in R
|
User Reviews
Be the first to review “Introduction to Data Visualization in R” Cancel reply
This site uses Akismet to reduce spam. Learn how your comment data is processed.

| Price | $9.99 |
|---|---|
| Provider | |
| Duration | 2 hours |
| Year | 2021 |
| Level | Beginner |
| Language | English ... |
| Certificate | Yes |
| Quizzes | Yes |

$34.99 $9.99



There are no reviews yet.