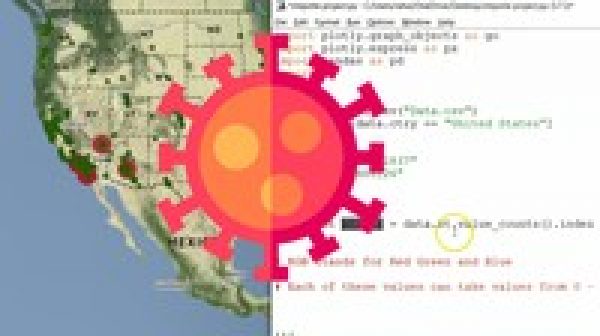
Data science – using python, plotly and leaflet
$84.99 $9.99Track price
This is a course for data visualization lovers.
It has been prepared with practical exercises of the current context for its better understanding and application in a 10 intensive hours.
In a first section, the methodological principles on data viz and graphic display techniques are explained. As an exercise, the extraction and deployment of COVID–19 data using python, Plotly and express submodule is developed.
Additionally, the course includes the geospatial application for the representation of geographic data using Plotly’s methods, and as an exercise the data from John Snow’s research on cholera is reconstructed.
Finally, scientific and statistical graphics and their display through animation code are explored. As a final project, the Leaflet code is used to explore interactive maps.
#AulaGEO
Section 1: Module. 1 Introduction to Data Visualisation
1. Introduction to data visualization
2. Why bother about it
3. Objectives of Data Visualisation
4. Theory of Data Vis
5. Practice
Section 2: Module. 2 Data Types and Chart Types
6. Continuos Variables and Histogram
7. Time Series and Line Chart
8. Categorical Data and bar chart
9. Categorical Data Type and pie chart
10. Pair of Continous variables
11. One Continuous and One Categorica
Specification: Data science – using python, plotly and leaflet
|
User Reviews
Be the first to review “Data science – using python, plotly and leaflet” Cancel reply
This site uses Akismet to reduce spam. Learn how your comment data is processed.
| Price | $9.99 |
|---|---|
| Provider | |
| Duration | 10 hours |
| Year | 2021 |
| Level | All |
| Language | English ... |
| Certificate | Yes |
| Quizzes | No |

$84.99 $9.99






There are no reviews yet.