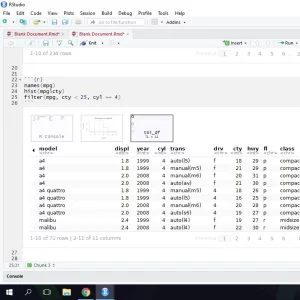
Perform simple or complex statistical calculations using R Programming! – You don’t need to be a programmer for this 🙂
Learn statistics, and apply these concepts in your workplace using R.
The course will teach you the basic concepts related to Statistics and Data Analysis, and help you in applying these concepts. Various examples and data–sets are used to explain the application.
I will explain the basic theory first, and then I will show you how to use R to perform these calculations.
Following areas of statistics are covered:
Descriptive Statistics – Mean, Mode, Median, Quartile, Range, Inter Quartile Range, Standard Deviation. (Using base R function and the psych package)
Data Visualization – 3 commonly used charts: Histogram, Box and Whisker Plot and Scatter Plot (using base R commands)
Probability – Basic Concepts, Permutations, Combinations (Basic theory only)
Population and Sampling – Basic concepts (theory only)
Probability Distributions – Normal, Binomial and Poisson Distributions (Base R functions and the visualize package)
Hypothesis Testing – One Sample and Two Samples – z Test, t–Test, F Test, Chi–Square Test
ANOVA – Perform Analysis of Variance (ANOVA) step by step doing the manual calculation and by using R.
Instructor Details
Courses : 7
Specification: Statistics for Data Analysis Using R
|
24 reviews for Statistics for Data Analysis Using R
Add a review Cancel reply
This site uses Akismet to reduce spam. Learn how your comment data is processed.

| Price | $13.99 |
|---|---|
| Provider | |
| Duration | 12.5 hours |
| Year | 2020 |
| Level | All |
| Language | English |
| Certificate | Yes |
| Quizzes | No |

$99.99 $13.99


Diego Alejandro Guerrero Perez –
It is not that intensive.
Premalata Bhate –
It was good,knowledgeble.Trainer was too good.
Minwei Deng –
Step by step walk through both the theories and the R applications. Very thorough and very intuitive which in itself a huge achievement on topics like this.
Zacharia K –
Instructor is awesome. Very easy to follow. He made me like statistics
Eduardo Jos Azevedo Corr a –
the English of the professor is not good, sometimes is difficult to understand
Phila Mtshali –
The lecture is very good at teaching statistics. He explains things in a manner that is easy to understand. I did a similar course and it was difficult to grasp concepts. I had to use a lot of supporting documents to past that course.
Gobinda Roy –
This is really an amazing course. Instructor nicely explained theory with numerical examples. He also explained the same concept using R. Very very nice. I am delighted. I highly recommend this course to students who like to learn the basic of statistics with many good number of examples using R. Thank you!
Mani k –
so far so good but I can’t say it is very good because still I am learning but it is good. it is worth of money.
Christine Jimenez –
Thorough and descriptive 🙂
Robert Rilling Smith –
Awesome so far, teacher explains concepts in a clear, engaging way. Thanks!
shiney Chakraborty –
Beautiful explanation…Thank you, Sir.
Nitin Sharma –
very good course to get hold of basic of statistics
Antonio Desdier –
It familiarized me with many advanced statistical techniques.
Nischal Singh –
Very detailed videos, loud and clear audio.
Nebo Rad –
It is almost perfect but it is a pity cause we do not have a auto tile option
Brenda Palmer –
The instructor is really good at explaining how to use R for statistical data analysis. I highly recommend!
Vangala Rajesh –
good
Claire Philippeau –
Very good, awesome!
Nurfidah Dwitiyanti –
The explanation of this course can easy to be understand. Thank you
Keily Jose Gutierrez –
Very nice course. Presenter did a great job explaining statistics concepts, and also I learned how to use R for statistic application. Highly recommended
Tarundeep Sobti –
Well explained …
H. K. S. de Zoysa –
this is excellent course
Joanne Higgins –
new to this program so helped explain the program
Abhishek Saraswat –
So far it is good, It will be good if also have transcript of the same.