8.1/10
(Our Score)
Product is rated as #263 in category Data Science
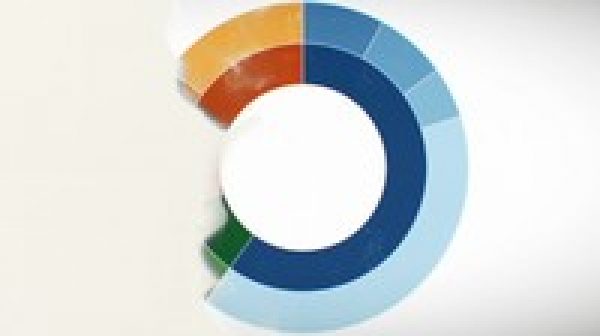
Tableau Desktop is often referred to as the Gold Standard for Data Visualization, Data Discovery and Self–Service Data Analytics, and caters for all users from IT Practitioners, to Data Scientists, to Data Consumers. In this course, we are going to push the limits of what we can show in Tableau by creating Bespoke (Custom) Data Visualizations, and more importantly, learn the techniques required, push our boundaries, and stretch our imagination.
Instructor Details
Votes: 0
Courses : 1
Specification: Creating Bespoke Data Visualisations in Tableau
|
13 reviews for Creating Bespoke Data Visualisations in Tableau
Show all
Most Helpful
Highest Rating
Lowest Rating
Add a review

| Price | $10.99 |
|---|---|
| Provider | |
| Duration | 3 hours |
| Year | 2019 |
| Level | Intermediate |
| Language | English |
| Certificate | Yes |
| Quizzes | No |

Creating Bespoke Data Visualisations in Tableau
$10.99


Thi Minh Ho –
This course guides me to build the building blocks before putting them altogether to build bespoke visualisations. Toan explains in a way that is easy to understand and makes the maths less scary. As Toan mentioned, it will require a lot of practice to be able to get hold of the technique and be able to create something by yourself. Thank you Toan and I hope you ll create more of these awesome courses for us.
Arsene –
Very nice course to start bespoke charts in Tableau, the most helpful part for me is how to design bespoke charts from inspiration around the life. Look forward to Toan’s next courses in Udemy.
Swaminathan Jayaraman –
So far I’m really enjoying the course. Toan is really an amazing instructor. He explains everything clearly and completely. Love his enthusiasm and his intro Welcome Welcome Welcome Welcome. I’d definitely recommend this course to anyone looking to create bespoke visualizations in Tableau.
Donato Villalba –
Very different Tableau course. Makes you think out of the box and about what’s possible to visualize.
Jackie Janosko –
I’m learning great techniques to make interesting charts for my data visualizations! This is a really well done course. The tutorials are detailed and easy to follow, with repeated applications of different techniques to help build your comfort level with them.
Zongyi Wang –
Very useful!
Matthias Giger –
Very good course with focus on one topic, very well structured and composed. I have learned a lot. Many thanks!
Jim Gordon –
Thank you Mr Hoang
Evan Baird –
This simplicity and power of how the teacher shows the boundless capabilities of Tableau. Also, I code in Python and on his blog he has an introduction to TabPy! I hope he creates a course for this Python library because that would be a game changer to use Tableau and Python!
Pablo Saravia Barros –
Fue una buena elecci n, muy buen curso para buscar inspiraci n sobre data visualization.
Gerardo V zquez M –
Very good,
Daniel Martinez –
Toan is a Tableau expert and his explanations are clear. With this course you will learn some key aspects and calculations that will enable you to go deeper on your Tableau knowledge 100% recommended!
Andrew Hills –
Engaging and enjoyable. Thanks Toan.