Latest Courses
ISTQB Artificial Intelligence Tester Sample ExamsCheck course
JAVA Programming Online Practice ExamCheck course
Programming for Kids and Beginners: Learn to Code in PythonCheck course
Practice Exams | Codeigniter 4 developer certificationCheck course
WordPress Practice Tests & Interview Questions (Basic/Adv)Check course
Git &Github Practice Tests & Interview Questions (Basic/Adv)Check course
Machine Learning and Deep Learning for Interviews & ResearchCheck course
Laravel | Build Pizza E-commerce WebsiteCheck course
101 - F5 CERTIFICATION EXAMCheck course
Master Python by Practicing 100 QuestionCheck course
ISTQB Artificial Intelligence Tester Sample ExamsCheck course
JAVA Programming Online Practice ExamCheck course
Programming for Kids and Beginners: Learn to Code in PythonCheck course
Practice Exams | Codeigniter 4 developer certificationCheck course
WordPress Practice Tests & Interview Questions (Basic/Adv)Check course
- 50% Python Scientific Visualizations with plotly

Python Scientific Visualizations with plotly

$9.99Track price

Add your review
Add to wishlistAdded to wishlistRemoved from wishlist 0
Add to compare
8.1/10 (Our Score)
Product is rated as #366 in category Python

Become a Master in Data Acquisition and Visualization with Python 3 and acquire employers’ one of the most requested skills of 21st Century! An expert level Data Science Professional can earn minimum $100000 (that’s five zeros after 1) in today’s economy.

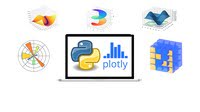
This is the most comprehensive, yet straight–forward course for the Data Science with Python 3 on Udemy! Whether you have never worked with Data Visualization before, already know basics of Python, or want to learn the advanced features of Plotly with Python 3, this course is for you! In this course we will teach you Scientific Data Visualization with Python 3, Jupyter, NumPy, Matplotlib, and Plotly .

(Note, we also provide you PDFs and Jupyter Notebooks in case you need them)

With over 75 lectures and over 8 hours of videos, this comprehensive course leaves no stone unturned in teaching you Scientific Data Visualizations with Python 3 and Plotly!

This course will teach you Data Science in a very practical manner, with every lecture comes a programming video and a corresponding Jupyter notebook that has Python 3 code! Learn in whatever manner is the best for you!

We will start by helping you get Python3, NumPy, matplotlib, Jupyter, Pandas, and Plotly installed on your Windows computer and Raspberry Pi.

Instructor Details

Ashwin Pajankar is a Science Popularizer, a Programmer, a Maker, and an Author. He has a Master of Technology in Computer Science and Engineering from International Institute of Information Technology Hyderabad (IIIT-H). Ashwin has published more than a dozen of books on Python Programming, Test Automation, Raspberry Pi, Computer Vision, Arduino, and Supercomputing with reputed global publishers like Packt, Apress, Leanpub, and BPB. He has reviewed five books on Data Mining, Machine Learning, Python 3 Programming, and Raspberry Pi for Packt. He has also reviewed a video course on Raspberry Pi for Packt. He has earned many professional certifications in the areas of development, administration, and testing from Oracle, IBM, Informatica, Teradata, and ISTQB. He has more than twenty five years of experience in STEM (Science, Technology, Engineering, and Mathematics), Programming, and Innovation. He started tinkering with electronics, home computers, programming, and science experiments at the tender age of 8. He began his programming journey with BASIC and Assembly Language of 8085 and x86 family. He has over a decade of work experience in a few big brands like Cisco Systems and Cognizant in technical roles. He also has worked in a couple of startups in technical leadership roles. Ashwin has trained thousands of professionals on the topics like Python Programming, Test Automation, Innovation, and IoT. He is committed to the vision of bringing Science and Technology education to masses. He has won several awards at university and workplaces for social initiatives and community service.

Specification: Python Scientific Visualizations with plotly

Duration

8 hours

Year

2019

Level

Beginner

Certificate

Yes

Quizzes

No

2 reviews for Python Scientific Visualizations with plotly

2.5 out of 5
0
1
0
0
1
Write a review
Show all Most Helpful Highest Rating Lowest Rating
  1. Frederico Sales

    O titulo do curso trata de uma biblioteca para analise cientifica plotly (https://plot.ly/python/user guide/), entretanto o conteudo apresentado outro completamente diferente, (raspberry, matplotlib, numpy, scipy) essas ferramentas eu conhe o e j utilizo. Buscava nesse curso aprimoramento das minhas habilidades na biblioteca supracitada e que faz parte do titulo do curso.

    Helpful(0) Unhelpful(0)You have already voted this
  2. Nandini Govindraj

    yes it was a very good course with giving knowledge about all systems

    Helpful(0) Unhelpful(0)You have already voted this

    Add a review

    Your email address will not be published. Required fields are marked *

    This site uses Akismet to reduce spam. Learn how your comment data is processed.

    Python Scientific Visualizations with plotly
    Python Scientific Visualizations with plotly

    $9.99

    Price tracking

    Java Code Geeks
    Logo
    Register New Account
    Compare items
    • Total (0)
    Compare