Latest Courses
ISTQB Artificial Intelligence Tester Sample ExamsCheck course
JAVA Programming Online Practice ExamCheck course
Programming for Kids and Beginners: Learn to Code in PythonCheck course
Practice Exams | Codeigniter 4 developer certificationCheck course
WordPress Practice Tests & Interview Questions (Basic/Adv)Check course
Git &Github Practice Tests & Interview Questions (Basic/Adv)Check course
Machine Learning and Deep Learning for Interviews & ResearchCheck course
Laravel | Build Pizza E-commerce WebsiteCheck course
101 - F5 CERTIFICATION EXAMCheck course
Master Python by Practicing 100 QuestionCheck course
ISTQB Artificial Intelligence Tester Sample ExamsCheck course
JAVA Programming Online Practice ExamCheck course
Programming for Kids and Beginners: Learn to Code in PythonCheck course
Practice Exams | Codeigniter 4 developer certificationCheck course
WordPress Practice Tests & Interview Questions (Basic/Adv)Check course
- 86% Business Analysis: Data Flow Diagrams to Visualize Workflows

Business Analysis: Data Flow Diagrams to Visualize Workflows

$10.99Track price

(5 customer reviews)
Add to wishlistAdded to wishlistRemoved from wishlist 0
Add to compare
8.0/10 (Our Score)
Product is rated as #19 in category Business Analysis

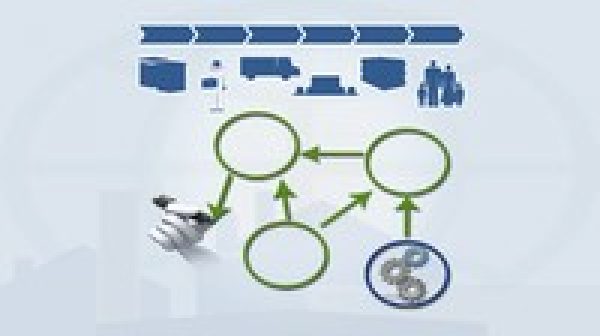
Learn about Data Flow Diagrams (DFDs), Context–level DFDs, and Rigorous Physical Process Models (RPPM), what they are, why they are important, and who can use them.

Getting from someone’s explanations of how they do their job to usable and accurate workflow descriptions can be a daunting proposition. Understanding current workflows, however, is critical to defining a future IT solution. Just as critical is understanding how data is created and consumed throughout the workflow.

To truly understand problems inherent in a business process or workflow, you need to help the practitioners visualize what they do. Visualization lets them identify better ways of working that remove current restrictions.

Data Flow Diagrams are phenomenal tools for visualization. Working with business experts, you can help them identify problems and inefficiencies they don t even know they have. These are not people problems; they are process problems. Understanding when and how to create and use Data Flow Diagrams will help you discover and capture the requirements for improving the use of information technology.


Why Should You Take this Course?

In this 90 minute video course, you will learn the benefits of process visualization for the business community, for the one wearing the BA hat, for those tasked with developing the solution, and ultimately for the entire organization.

Instructor Details

Tom has been in business analysis since long before it was called business analysis. He has over 30 years experience in the fields of information technology, methodologies, and business analysis. In his writings and lectures he strives for enlightening while entertaining. As a facilitator, he achieves results through inclusion and synergistic group-building. He has taught thousands of students business and systems analysis skills since the '80's and has facilitated hundreds of requirements discovery sessions under a variety of acronyms (JAD, ASAP, JADr, JRP, etc). Angela and Tom Hathaway (previously Hathaway & Associates, Inc. and Requirements Solutions Group, LLC) founded BA-EXPERTS in 2011. As a team, Angela and Tom have trained, consulted, mentored and coached thousands of business analysts around the world for organizations from small businesses to Fortune 100. Current and past customers include TIAA-CREF (Financial), Cathay Pacific (Airline), Manitoba Telecom Services (Telecommunications), Starwood Hotels and Resorts (Hospitality), government agencies, and a myriad of organizations spanning all sizes and industries. Tom and Angela's training, consulting, and mentoring efforts have saved their customers around the world millions and can help your organization improve its business analysis practices.

Specification: Business Analysis: Data Flow Diagrams to Visualize Workflows

Duration

1.5 hours

Year

2019

Level

All

Certificate

Yes

Quizzes

No

5 reviews for Business Analysis: Data Flow Diagrams to Visualize Workflows

4.4 out of 5
2
3
0
0
0
Write a review
Show all Most Helpful Highest Rating Lowest Rating
  1. Melinda Kucsera

    Yes. I am tasked with creating work flow diagrams.

    Helpful(0) Unhelpful(0)You have already voted this
  2. Jun (Bonnie) Yi

    It is nicely structured, but the pace got a bit too fast towards the end. maybe it is just me. Love the technique demo 🙂

    Helpful(0) Unhelpful(0)You have already voted this
  3. Alicja Wiszniewska

    Simple and clear. Very well done.

    Helpful(0) Unhelpful(0)You have already voted this
  4. Eric Ganser

    the reference handout slides could use a little more text to provide the takeaway for the graphic.

    Helpful(0) Unhelpful(0)You have already voted this
  5. Frank Neffgen

    In dieser Weise habe ich es mir vorgestellt

    Helpful(0) Unhelpful(0)You have already voted this

    Add a review

    Your email address will not be published. Required fields are marked *

    This site uses Akismet to reduce spam. Learn how your comment data is processed.

    Business Analysis: Data Flow Diagrams to Visualize Workflows
    Business Analysis: Data Flow Diagrams to Visualize Workflows

    $10.99

    Price tracking

    Java Code Geeks
    Logo
    Register New Account
    Compare items
    • Total (0)
    Compare