
In this course I have compiled a set of instructions that anyone with a computer can use to create useful analytics around open data sources. As you might have noticed that data and especially data around healthcare is extremely hard to get by. I have therefore carefully put together various data sources that are extremely valuable and are still available free as open data. Once I show you where the data is and how to procure it through various APIs etc., I also demonstrate how to slice and dice it using another great set of freely available software R. The lectures include step by step guidance and instructions in each line of code work and how to modify the code to use it in other projects of yours. The goal of this course is to provide you both data and the tool set to extract maximum value for your time and effort. I start the instructions with procuring, analyzing and visualizing Covid–19 data.
Along with data i provide step by step instructions to use R for creating analytics and appealing visualizations.
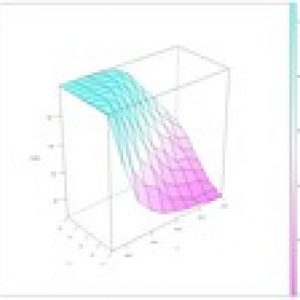
These visualizations include using ggplot2 library to create scatter or bar charts. Since we have access to time series data, I show how to create movies and gifs to display dynamic time lapse visualizations. We will explore Covid 19 cases, deaths or vaccinations across multiple geographic areas, including country, state and county levels.
Specification: Covid 19 analytics with live open data and R in 1 day
|
User Reviews
Be the first to review “Covid 19 analytics with live open data and R in 1 day”

| Price | $9.99 |
|---|---|
| Provider | |
| Duration | 2.5 hours |
| Year | 2021 |
| Level | Beginner |
| Language | English ... |
| Certificate | Yes |
| Quizzes | No |

$9.99


There are no reviews yet.